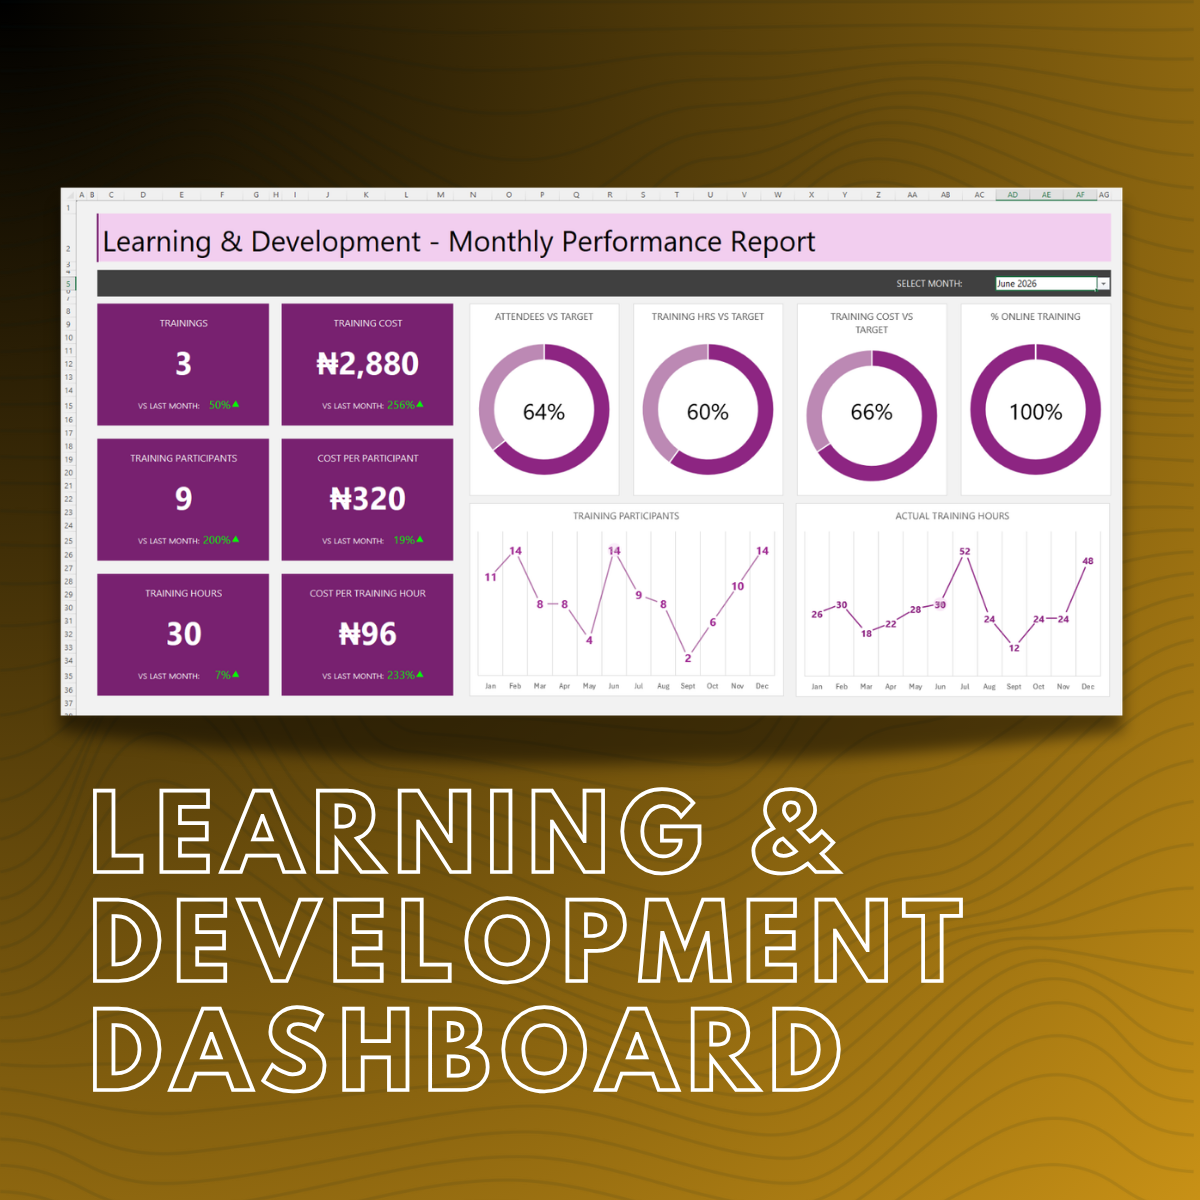
Learning & Development Performance Dashboard Interactive Excel Template
Elevate your L&D monthly performance reporting with this interactive dashboard
Most HR and L&D professionals are buried under mountains of raw training data that stay trapped in messy, unreadable spreadsheets. When leadership asks for a status update on training ROI or monthly engagement, you shouldn't have to spend hours manually calculating percentages and copy-pasting charts into PowerPoint decks. Presenting scattered data doesn't just waste your time - it obscures the actual value your department provides to the company.
The 101ExcelHacks L&D Performance Dashboard transforms that chaos into a high-impact, interactive command center. This isn't just a spreadsheet; it’s a professional reporting system designed to turn raw attendance and cost rows into actionable insights with zero manual upkeep.
Key Features & Insights:
Dynamic Month Selector: View any month's performance instantly with a single dropdown - no more filtering through endless rows.
Automated KPI Cards: High-level metrics for Total Trainings, Participants, and Costs with built-in trend indicators (green/red) against previous months.
Advanced Cost Analytics: Track "Cost per Participant" and "Cost per Training Hour" to prove the financial efficiency of your programs.
Visual Trend Tracking: Interactive line charts for Training Hours and Participants that update automatically to show year-to-date progress.
Whether you are looking to build this from scratch using our included logic or want a ready-to-use template for your next meeting, this tool provides the clarity your department deserves. Elevate your HR reporting today.