
[The below is an updated post]
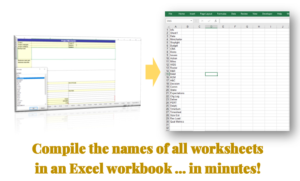
The following macro came in useful for me when I had to prepare a PowerPoint report showing multiple views generated from an Excel table. This macro works by automating the process of copying and pasting ranges (groups of cells) from Excel to PowerPoint as pictures. Also, the macro automates the process of moving from one scenario to the next, and creates a new PowerPoint slide for each scenario, thus ensuring I had 8 slides in total at the end.
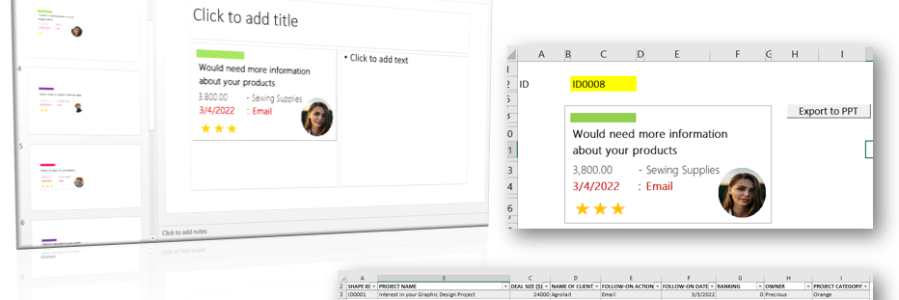
I have a table with 8 records:

And I have created a small dashboard summarizing the records into a compact view on a second sheet named “template”. This dashboard is dynamic and on updating the yellow cell above (Shape ID), it returns the corresponding record for that ID.


I wanted to export all the views to PowerPoint so each record is presented on one slide at a time. But I didn’t want to go through the process of copying, pasting and resizing the dashboard. Here’s the macro that helped me out.
To use this macro, you will need activate Microsoft PowerPoint Object Library (from Visual Basic, Tools > References) for this macro to work. The steps to do this are shown in the snapshots below.


Before running this macro, I made two updates to the workbook:
- I selected the range of cells in the dashboard and named the range “listRange”

2. I created an INDEX() formula in the yellow cell and an index cell, so that the update of the dashboard from one view to the next could be controlled through that index cell. I named the index cell using the Name Manager (“indexCell”).

Sub Export2PPT()
‘STEP 1: DECLARE VARIABLES TO HOLD THE POWERPOINT APPLICATION (PPT), POWERPOINT PRESENTATION (currPPT), POWERPOINT SLIDE (sld),
Dim PPT As Object
Dim ws As Worksheet
Dim currPPT As PowerPoint.Presentation
Dim sld As PowerPoint.Slide
Dim rng As Range‘STEP 2: OPEN POWERPOINT APPLICATION AND MAKE THE WINDOW VISIBLE
Set PPT = CreateObject(“Powerpoint.Application”)
PPT.Visible = True‘STEP 3: CREATE A NEW PRESENTATION DOCUMENT, AND ASSIGN THE CREATION OF A NEW SLIDE TO THE sld VARIABLE
Set currPPT = PPT.Presentations.Add
‘STEP 4: CREATE A LOOP THAT RUNS FROM 1 TO 8, UPDATING currCard WITH EACH LOOP, TO UPDATE THE DASHBOARD WITH EACH RECORD, COPY THE DASHBOARD AND PASTE INTO A NEW SLIDE IN POWERPOINT
Set sld = currPPT.Slides.Add(Index:=1, Layout:=ppLayoutTitle)
For i = 1 To 8
Set ws = ActiveWorkbook.Sheets(“template”) ‘CHANGE ‘template’ HERE TO THE NAME OF YOUR OWN WORKSHEET
ws.ActivateRange(“indexCell”).Value = i ‘SET THE INDEX CELL TO BE THE CURRENT VALUE OF i (1-8
Set rng = Range(“ListRange”) ‘COPY THE DASHBOARD RANGE OF CELLS
Rng.Select
Rng.CopySet sld = currPPT.Slides.Add(Index:=currPPT.Slides.Count + 1, Layout:=ppLayoutChartAndText)
With sld.Shapes.PasteSpecial(ppPasteBitmap) ‘PASTE THE RANGE OF CELLS INTO A NEW SLIDE
.ScaleHeight 1.9, msoTrue ‘I INCREASED THE SCALE SO THAT THE DASHBOARD FILLS UP AT LEAST HALF OF THE SCREEN
.Top = 145 ‘THE TOP AND LEFT POSITION MOVE THE NEW SHAPE
.Left = 70
End With
Next iEnd Sub

As a last step, I assigned the macro to a button on the dashboard sheet for ease of access.