Linked pictures are a useful feature in Excel, and when creating dashboards they are a great way to maximize worksheet space and enable visual representation of more metrics and KPIs in one view.
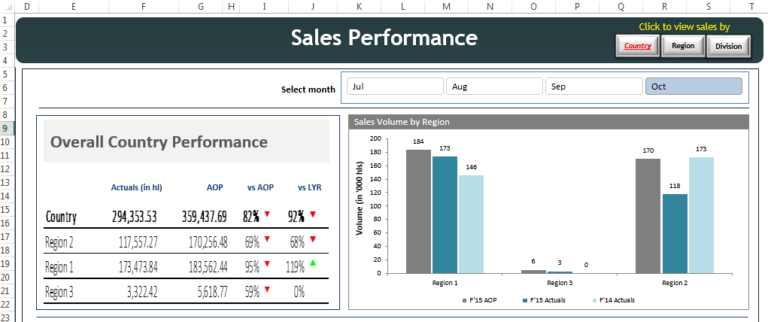
For example, a summary dashboard view like the one below:

is powered from one of the sheets at the back end of the workbook. The table below is where all the calculations are done.

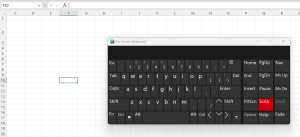
The linked picture is generated by copying the table and clicking Paste>Paste Special>Paste as Linked picture (look out for the icon highlighted in yellow below)

The picture, being linked, will update when the values on the backend get updated, giving an interactive feel to the dashboard.

Thanks for the information! Very useful.
very helpful