Data reports have become one of the more popular applications of Excel in daily life. We summarise data into charts, tables and other graphs on a regular basis to provide a snapshot of business health, sales performance, financial results and many other scenarios. If you are using Excel to provide an account of performance over time, region, customers, products and other like dimensions, there is a squad of Excel functions available to help you get the job done, hassle-free.
Before we review the Data Report Function Squad line-up, there are a couple of standard performance reporting questions that are answered in data reports. These questions form the premise of the selection of these set of functions in this squad line-up. This post will explain the application of these functions as they help to address the primary queries that come up during a review of a performance report.
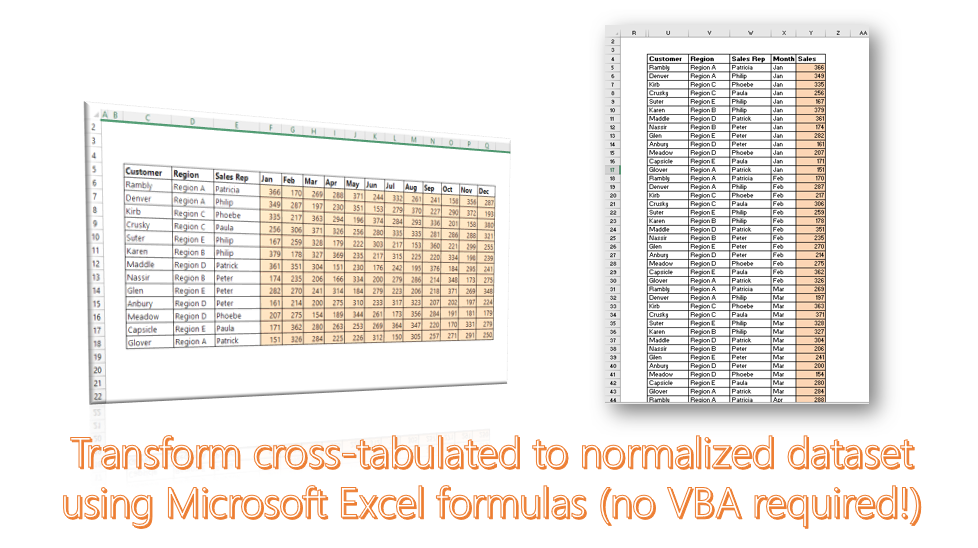
Data to be analysed in a data report usually comes in a tabular format. The rows on the table reflect a unique entry of the reporting measure (the unit of performance, which might be units of items sold, number of inventory, etc.), and the columns reflect the different dimensions defining the reporting measure (which might be time, region, customer, sales representative, etc.). Most data tend to be multidimensional, having more than one dimension to measure each unit of performance on.

In view of this, given the example of a sales performance report, data reports will typically be expected to provide answers to the following type of questions:
- How many units in total did we sell within the last time period?
- How many units by [DIMENSION] (meaning customer, region, product, sales representative, etc.) did we sell within the last time period?
- What were the top performing [DIMENSION] and lowest performing [DIMENSION]?
- How does our sales within the last time period compare with the period before that? Or with this time last year?
THE DATA REPORT SQUAD
- SUM() – adds up all the numbers within a specified range
- COUNT() – counts all the items within a specified range
- AVERAGE() – finds the arithmetic mean for the cells specified by a given condition or criteria


- SUMIF/S() – adds up the cells specified by a given condition or criteria. SUMIF is used for when there is one criteria (or dimension), while SUMIFS is used when there is more than one criteria.


- COUNTIF/S() – counts the number of cells within a range that meet the given condition. COUNTIF is used for when there is one criteria (or dimension), while COUNTIFS is used when there is more than one criteria.


- AVERAGEIF/S() – finds the arithmetic mean for the cells specified by a given condition or criteria. AVERAGEIF is used for when there is one criteria (or dimension), while AVERAGEIFS is used when there is more than one criteria.


- SUMPRODUCT() – returns the sum of the products of corresponding ranges or arrays. The SUMPRODUCT function can also be used in place of the =COUNTIF and the =SUMIF function

- SUBTOTAL() – returns a subtotal in a list or database. The subtotal can be a COUNT, SUM, AVERAGE, STANDARD DEVIATION or others. You can use SUBTOTAL to summarise your data across these parameters

- RANK() – returns the rank of a number in a list of numbers. The RANK function can be used in two ways – to create an ascending list, or to create a descending list


One thought on “Excel Hack 55: The Data Report Function Squad”