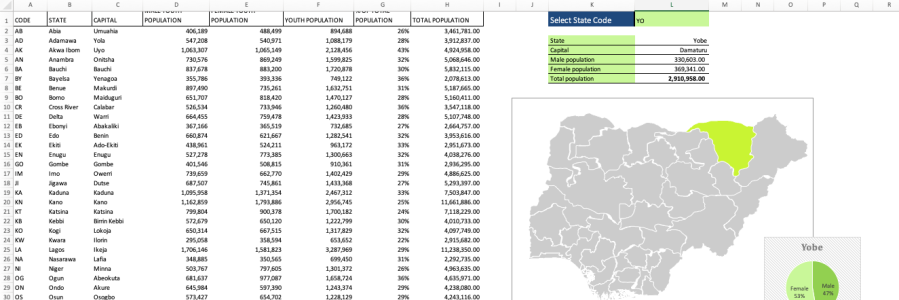
If you want to represent research or analysis based on geography, the preferred graphic is usually a map. Each geographic unit (continent, country or county) can be uniquely colored based an agreed color scale to represent the information to be communicated for that unit. When working with data spread over a diverse scale, having to manually color each geo unit can get tiresome. Using Excel however, after a one-time set up of all the geo objects to be used, this process can be simplified and made faster.
My example features a representation of data on a 2-point scale – PRESENT and NOT PRESENT. This task involved three components:
- an Excel table containing the two columns: a list of the states in Nigeria and a “status” column providing a description of the data point to be demonstrated. In my example, I’m simply using “PRESENT” and “NOT PRESENT” as my map is visualising product reach by Nigerian state. A named range (“StateList”) will be created from this table (set up named ranges in Excel by selecting all the focus cells and pressing Ctrl+F3)
- a graphic of a map of Nigeria, with each state as a different object. I made one by tweaking some .sbx files using ArcGIS software. Copy and paste this map into Excel, and name each of the 37 state shape objects by the state’s name. e.g. “Abia”, “Oyo”, “Cross-River”.
- a bit of code (Excel VBA). This is a simple macro that loops through each of the 37 state objects, recognises the name of the object, checks the name on the Excel table to find out if it has been indicated as “PRESENT” or “NOT PRESENT”, and recolours the object based on its status:
Sub UpdateMap()

'create two objects - a String and a Shape - that will hold the name of the current state object and its name while the code is looping through the 37 states

Dim myShape As String
Dim aShape As Shape


For i = 1 To 37

    'nowState is a range object that records the name of the current State and is used to refer to the corresponding State shape

    nowState = Application.WorksheetFunction.Index(Range("StateList"), i, 1)
    myShape = nowState

    Set aShape = ActiveSheet.Shapes(myShape)


    'nowPresence is a range object that records the status of the current State and is used to check against the two criteria
    nowPresence = Application.WorksheetFunction.VLookup(nowState, (Range("StateList")), 2, 0)

    Select Case nowPresence

     Case Is = "NOT PRESENT"
     aShape.Fill.ForeColor.RGB = RGB(204, 204, 204)


     Case Is = "PRESENT"
     aShape.Fill.ForeColor.RGB = RGB(4, 169, 4)


    End Select

Next i


End Sub