When tracking the status of project activities using Excel project plans, having to filter through several rows of text to find sub-tasks/activities related to a project can be cumbersome, and this is only made slightly better when data filters are in place. A cleaner and quicker way to get a concise view of all the project sub-tasks could be to create a dashboard that will serve as a landing view once the document is opened.

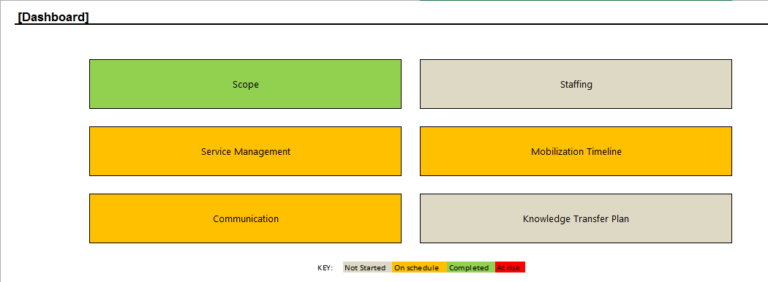
This dashboard will show the names of the sub-tasks with their overall RAG status, and clicking on the name of the task will take you to the project plan which has already been filtered to show only sub-tasks related to the selected task:

Setting this dashboard up will require the following:
- a project plan in Excel set up as an Excel table (use “Format as Table” option in the Home tab)

2. a macro (activated when a task name on the dashboard is clicked) that filters the project plan table using the task name clicked. Learn how to create such a macro in this post
3. a conditional formatting rule running on a =VLOOKUP() condition
Step 1: In the project plan table, create a new column (“Values”) next to the status column, and use the =VLOOKUP() function as shown in snapshot below to assign an index number to each reported status.

Step 2: Create a summary rough table in the document (in my example, I placed it under the project plan table) that calculates the average value of index numbers for the sub-tasks by task. The combined formula =SUMIF()/COUNTIF() is used to generate this average.

Step 3: With the values in the new table, generate four conditional formatting rules to assign RAG status colors to the task names in the dashboard tab based on the average value against each task

Create three additional conditional formatting rules to assign appropriate colors when the =VLOOKUP() returns 1, 2 and -1 respectively. This will result in the below view:
Step 4: Place the code below in the active sheet’s object in Visual Basic to activate a filter of a task in the project plan when the task name is clicked in the dashboard view. Prior to doing this, create a named range (Ctrl+F3, then select “New”) containing only the cells with task names in the dashboard tab to limit the macro’s working range. Hold the Ctrl button down to select cells that are not contiguous:

Private Sub Worksheet_SelectionChange(ByVal Target As Range)
If Not Intersect(Target, Range(“TaskRange”)) Is Nothing Then
CurrTask = Target.ValueSheets(“Project Plan”).Select ‘change Project Plan to appropriate sheet name of tab containing plan
ActiveSheet.ListObjects(“Table1”).Range.AutoFilter Field:=1, Criteria1:=CurrInit ‘confirm Table1 is correct name of your table
End IfEnd Sub